II. Spending & Endowment Reliance
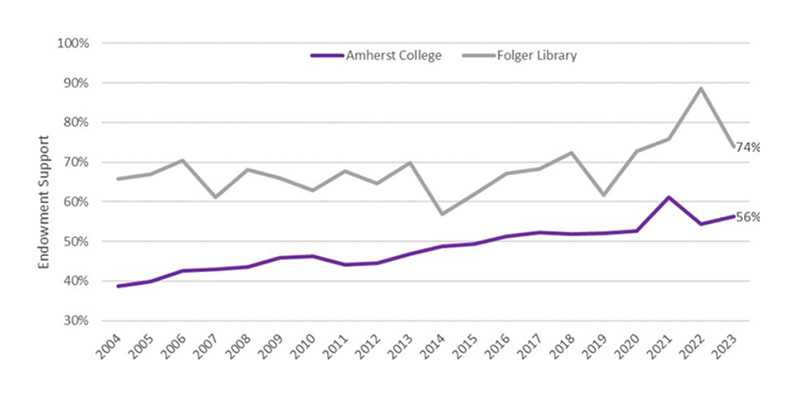
The LTIP today provides substantial operating support to both the College and the Library, with annual spending from the endowments this year contributing 56% and 74% of their budgets, respectively. For both, this represents the largest single source of revenue.
Budget Reliance on Endowment Spending (% of Annual Budget)
* Amherst’s fiscal year 2021 distribution includes $12 million supplemental endowment distribution for COVID-related expenses. The Folger’s distributed funds also cover large capital projects, sometimes in excess of $2 million per year.
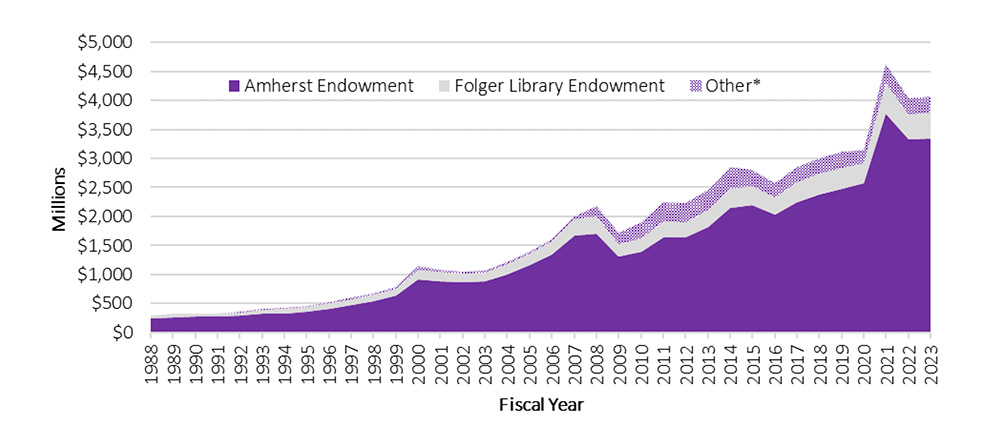
Spending has grown steadily, with the distribution rate ranging from 4.1% to 5.0% over the last decade. In fiscal year 2023, the endowment provided $136 million to the College and $17 million to the Folger Shakespeare Library, growing nearly fourfold over the last 20 years, from $34 million for Amherst and $7 million for the Folger in 2004. In the last decade in particular, a growing endowment has helped fund enhancements to the College’s financial aid program, which in turn limited the growth of the College’s second largest revenue stream (net comprehensive fees). The third key component of revenue for the College is gifts, and the College has benefited tremendously from the generosity of its donors. Our modeling suggests that endowment reliance will continue to increase; we embrace this financial model, but must manage it appropriately.
College Revenue Sources Over Time
* Amherst’s fiscal year 2021 distribution includes $12 million supplemental endowment distribution for COVID-related expenses.
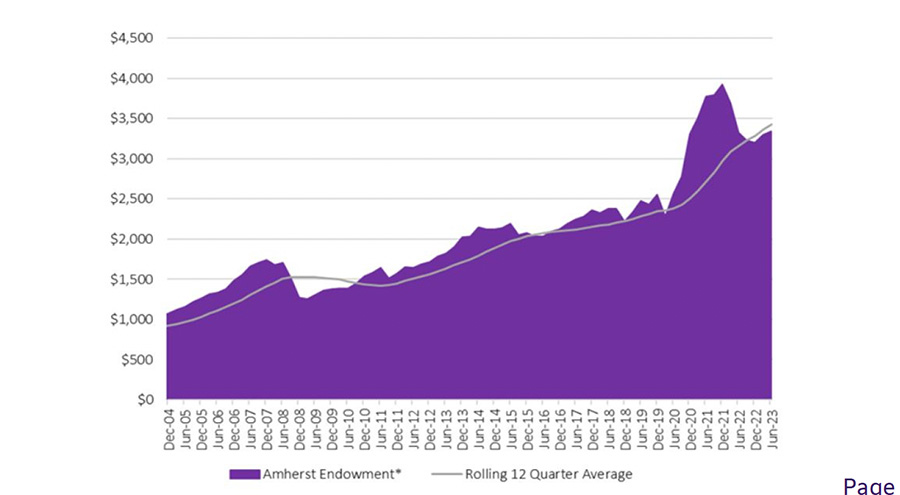
In order to manage the risk of sourcing substantial operating funds from a fully invested—and equity-oriented—endowment, the College has a spending rule that is designed to promote relative stability in the spending stream while still benefiting from asset growth over time. It combines a three-year smoothed historical endowment value (30%) with a modest increase (inflation) in last year’s spending value (70%). The three-year smoothed endowment value enables the building of endowment values in good years, which are then “spent” during more volatile markets, as you can see when comparing the endowment value over time to the smoothed value.
The last three fiscal years are an excellent example of how the spending formula works. In fiscal year 2022, spending from the endowment rose 6.0% relative to a 52.2% return on the endowment the year before (excluding the fiscal year 2021 $12 million supplemental endowment distribution for COVID-related expenses). In fiscal year 2023, spending from the endowment rose + 16.5%, despite a -10.0% return the year before. And in fiscal year 2024, spending will rise again, at a more muted 5.5%. The annualized increase in endowment spend over that three-year period is 9.3%, with no “down” years. This compares to a 9.2% annualized growth in the endowment (returns + gifts – spending) over that period, with a considerable “down” year in 2022, when the endowment value fell -10%. In other words: our smoothing policy dampens the impact of the markets on the draw, thereby shielding the operating budget from short-term equity volatility while allowing it to benefit from long-term equity growth over time.
Amherst Endowment & the Smoothing Effect
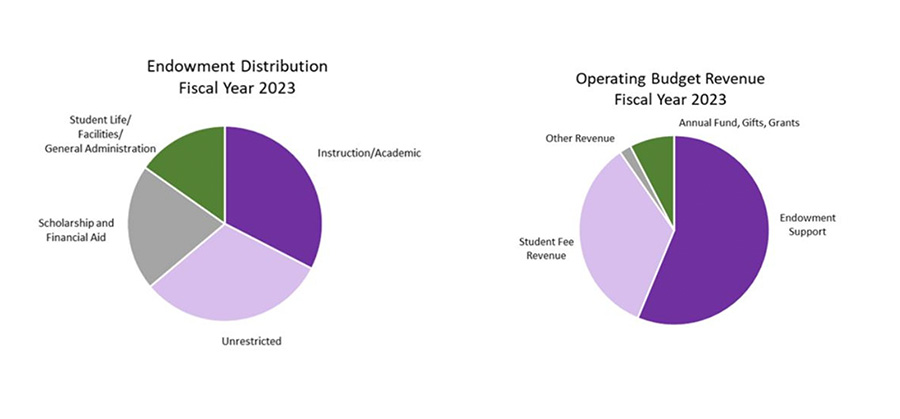
Where do all of these monies go? As you can imagine, supporting over half of the operating budget means the endowment spending covers a large share of all of the College’s efforts.
Amherst Endowment Distribution & Revenue Composition
There are 1,808 individual endowment funds in the LTIP, and they cover an array of purposes, including support for scholarships, professorships, instruction, research and operations.