Hands on Data Analysis in Geophysics
The Earth can be a challenging thing to measure. We are interested in the properties at the top of the atmosphere and the center of the planet, at the local and the global scale. Without being able to directly sample much of the Earth system, we turn towards clever applications of physics to measure (or at least, infer) the structure and dynamics of the planet. This class is meant to be a survey of geophysical methods, giving students an opportunity to collect and analyze a new type of data each week, highlighting both the theory and the practice of geophysics.
Below are some products generated by students taking Geology 341 over the course of the semester.
1 -- Photogrammetry and Point Cloud Evaluation:
Metersticks are not the only way we can measure size and shape. For many geologic materials that we either cannot access or risk damaging, remote methods are the only way to get a sense for object scale, and photogrammetry provides a pathway for the digital preservation of physical systems. Below are pointclouds generated by students in the Beneski Museum of Natural History using only 30 images collected using their cellphones. Using open source software, students were able to use photos to reconstruct the 3D scene and safely measure the morphometry of natural samples.
2 -- GPS Positioning and Sources of Error:
We all rely on GPS satellites to locate ourselves and navigate as we move around Earth's surface. The technology also enables very precise mapping of Earth's surface, as well as directly measuring the dynamics of the Earth system. But GPS data are not without sources of error and uncertainty. Students took out handheld an precision GPS to try and induce and quantify sources of position error around campus. You can see an example student group's ground track and the associated error associated with poor satellite coverage and multi-path effects below.
3 -- Earthquake Location and Analysis:
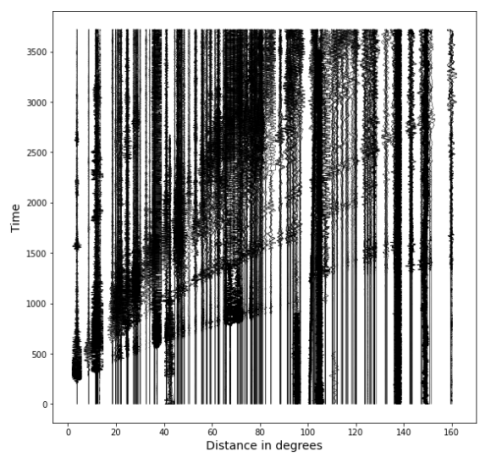
Our best method for probing the interior structure of the planet is using seismic waves generated during earthquakes. But the first step in this process is estimating the position and timing of the source of propagating waves. We can use P- and S-Wave arrival times to infer the distance from a seismometer to the Earthquake source. With an initial guess at the position, we can refine the earthquake location using theoretical travel-time curves for the easier to pick P-waves. Below is an example of the earthquake location problem completed by students in Geology 341, plotting station distances from S-P differences and model-observation misfit for the refined location using the P-wave arrivals.
4 -- Wave Splitting, and the Relationships between Seismology and Optical Mineralogy:

We leverage a large number of wave properties to characterize Earth materials. In the laboratory, we have been using the polarization (and repolarization) of light waves as they pass through minerals as a primary method for material identification. This problem is fundamentally the same as shear-wave splitting methods employed in seismology. By bringing students into the mineralogy lab, we can build intuition for wave-splitting and anisotropy with my favorite wave sensor: our eyes.
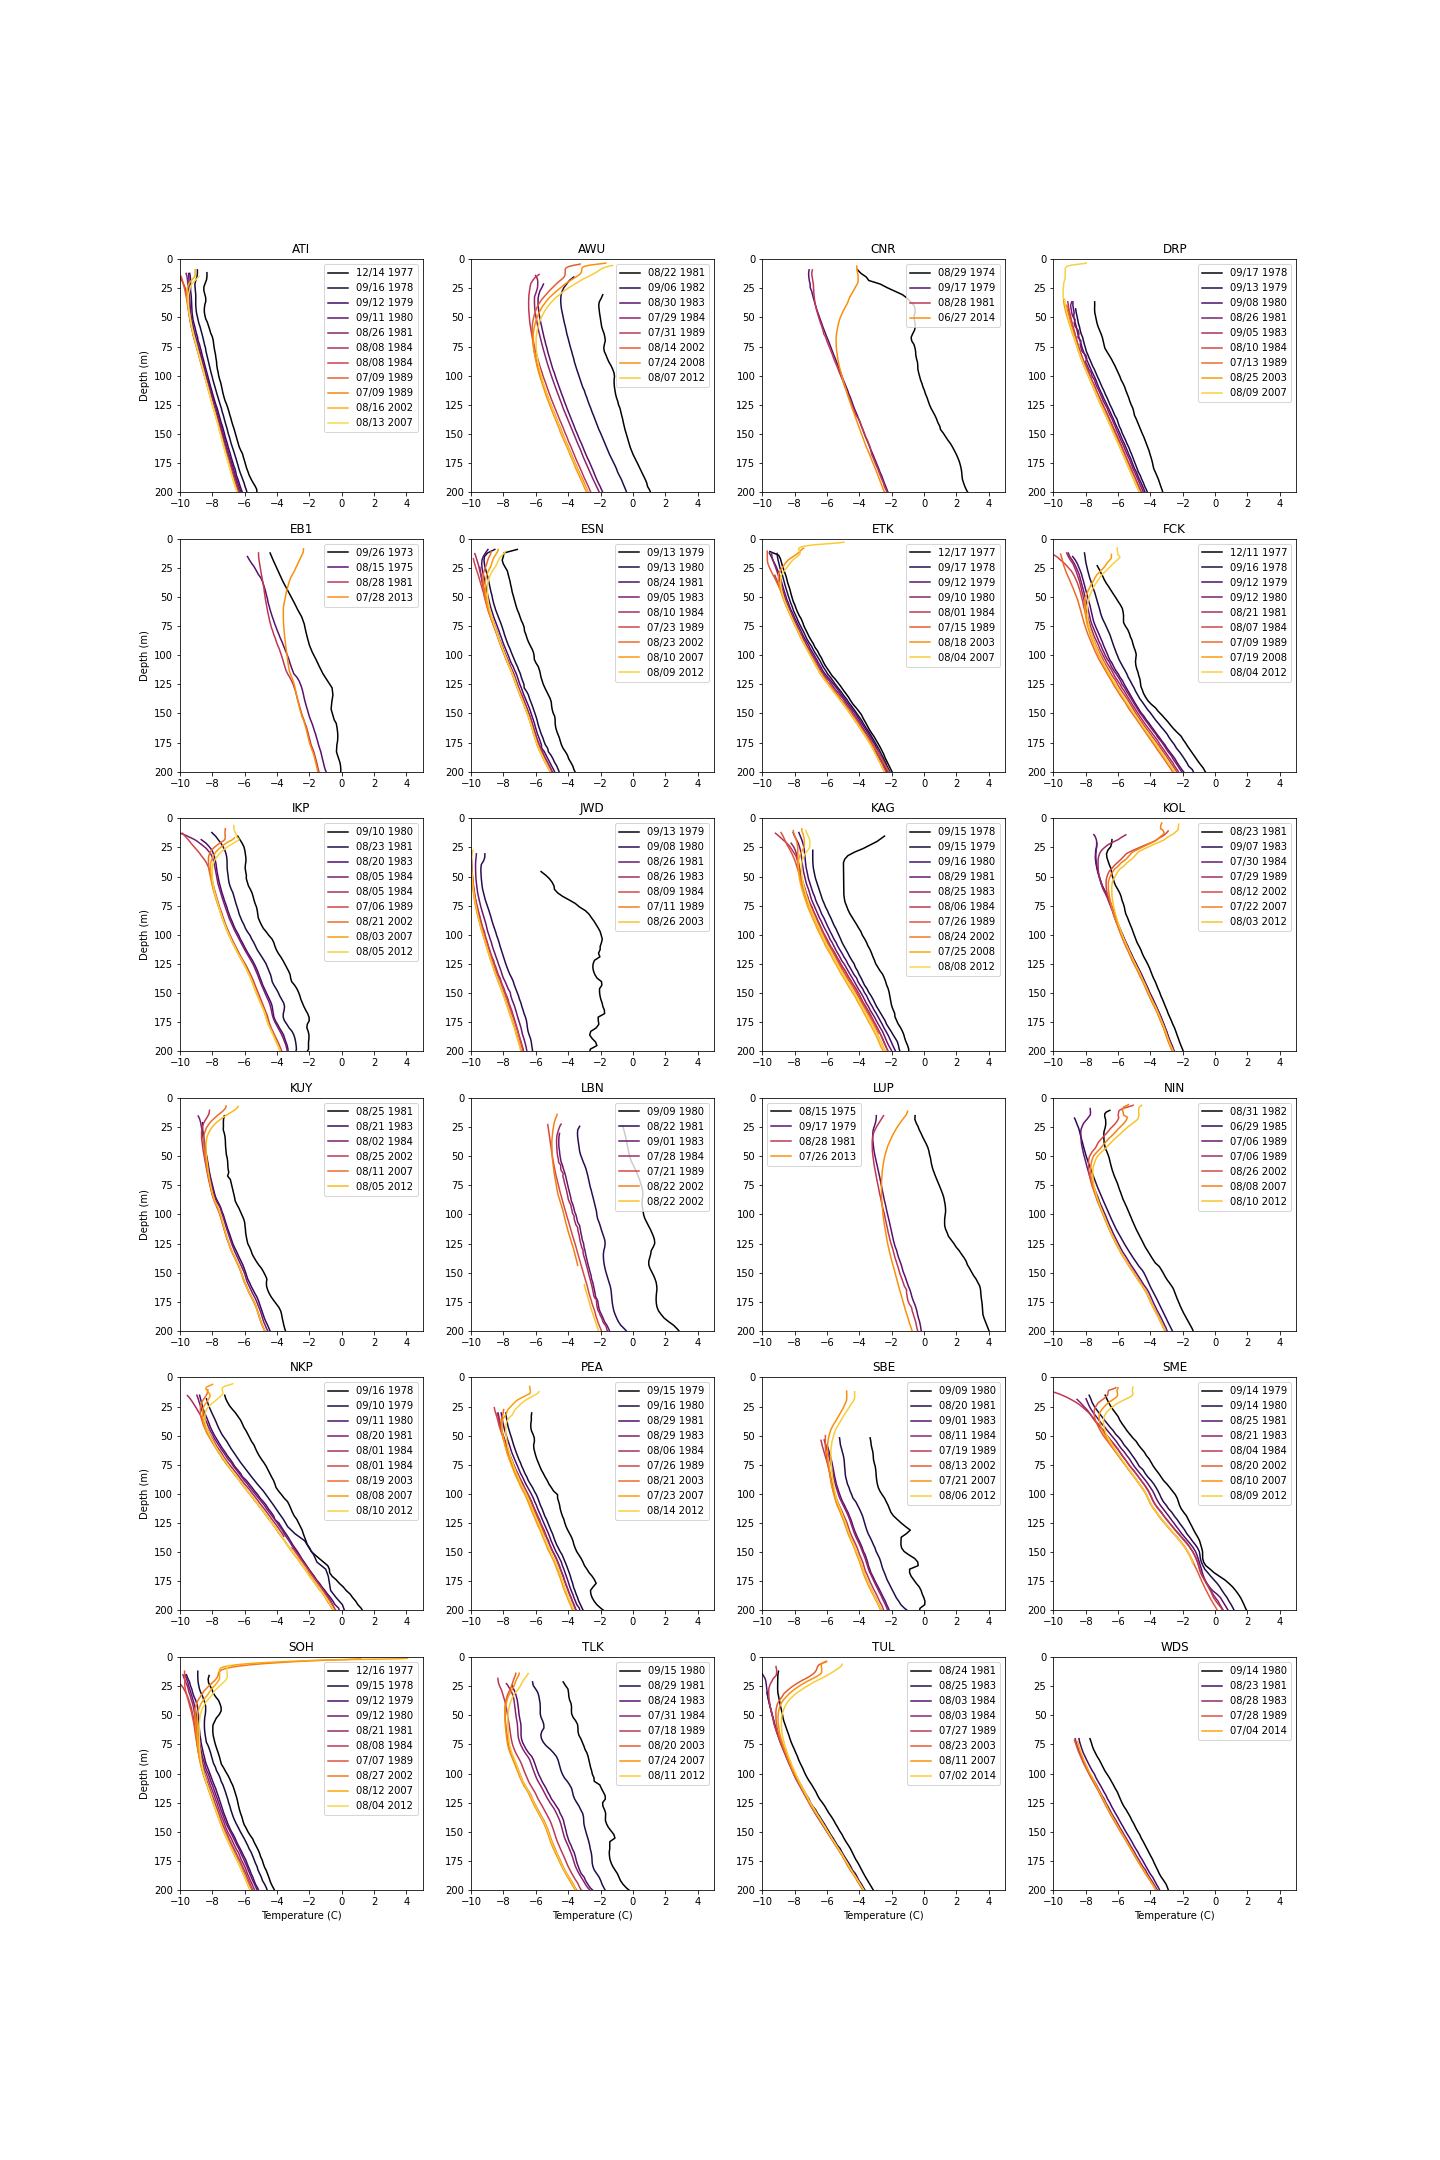
5 -- Heat Flow Modeling as a Tool to Measure Climate Change:
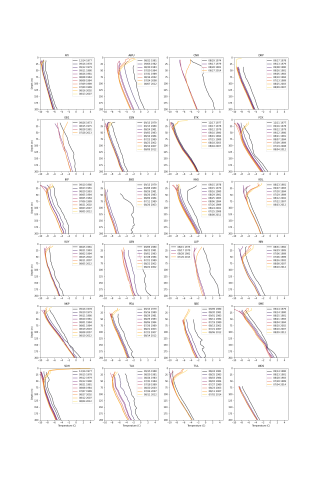
Heat flow measurements are both a useful tool for understanding solid Earth properties (theycan tell you about thermal characteristics of the subsurface as well as large-scale Earth structure) and for evaluating changes to the Earth system through time. In lab, students developed and implemented their own thermal model using Google Sheets, in an effort to deconstruct borehole temperature measurements made at permafrost sites in the Alaskan Arctic. In these borehole temperature records, there is a signal of both the timing and magnitude of modern climate change, that the students reproduce using their own thermodynamic models.
| Attachment | Size |
|---|---|
|
511.47 KB |

|
7.77 MB |